Author: Zhang Yaqi, Wall Street Insights
The US stock market is experiencing a rare internal rift – the index remains unmoved, but the ground beneath it is in complete disarray.
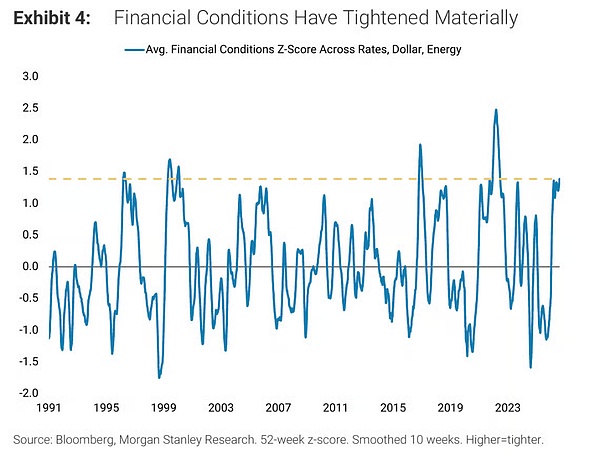
In a recent report, Morgan Stanley's chief equity strategist, Mike Wilson, warned that tightening financial conditions are quietly doing part of the Federal Reserve's job, but the impact is being absorbed primarily by ordinary stocks rather than a few AI-driven giants. With the 10-year Treasury yield breaking 5.3%, the dollar reaching a new high for this cycle, and oil prices remaining high, the Morgan Stanley Composite Financial Conditions Index has jumped to approximately 1.4 standard deviations. This level has only been breached a few times in the past 35 years, last seen in 2022 when the Fed raised rates by 75 basis points at each meeting. Meanwhile, Goldman Sachs has revised its forecast to another rate hike by the FOMC in October.
The key cracks in the market are now clearly visible: the S&P 500 equal-weighted index has lagged the market capitalization-weighted index by 6% over the past six months. In September, when the 10-year yield broke through 5%, the equal-weighted index fell by 5% in a single month, while the market capitalization-weighted index remained almost flat. While Goldman Sachs' Tony Pasquariello has some reservations about the "breadth collapse" narrative, he acknowledges that the median value of S&P 500 components has fallen 15% from its 52-week high, the worst reading since the bursting of the dot-com bubble. This divergence between the two institutions precisely outlines the most crucial question in the current market: how will this divergence end?
Financial conditions have been tightened significantly behind the scenes.
On the surface, the stock market index appears calm. But Wilson points out that the real tightening has already begun beneath the surface.
Morgan Stanley's composite financial conditions index—a 52-week Z-score that combines interest rates, the dollar, and energy prices—has climbed to about 1.4 standard deviations, second only to the level seen during the aggressive rate hike cycle of 2022. This tightening is not due to a single variable, but rather a confluence of factors: the Federal Reserve raised the federal funds rate by 25 basis points to 3.75%-4.00% last month, with Fed Chairman Warsh citing strong labor data, sticky inflation, and geopolitical factors boosting commodity prices; meanwhile, the 10-year Treasury yield has risen by about 130 basis points since February, with about 120 basis points coming from rising real yields.
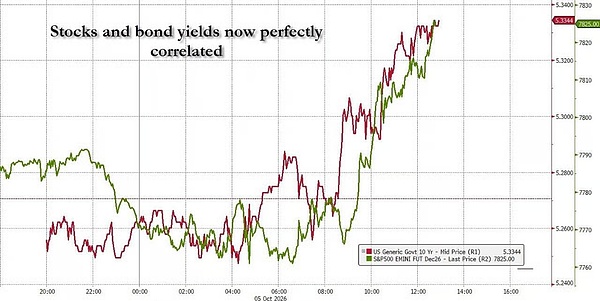
Wilson emphasizes the crucial role of yield drivers. Historically, the stock market has typically absorbed yield increases driven by breakeven inflation expectations; however, increases dominated by real yields tend to exert more direct pressure on valuations, which explains the current significant negative correlation between stocks and bonds. He also points out that with nominal GDP growth approaching 6%, the 10-year yield remaining above 5% is not abnormal—the ultra-low interest rates of the 2010s were the historical anomaly, and the bond market is merely returning to equilibrium.
Common stocks have already been subjected to real shocks.
The cost of rising yields is being disproportionately absorbed by common stocks.
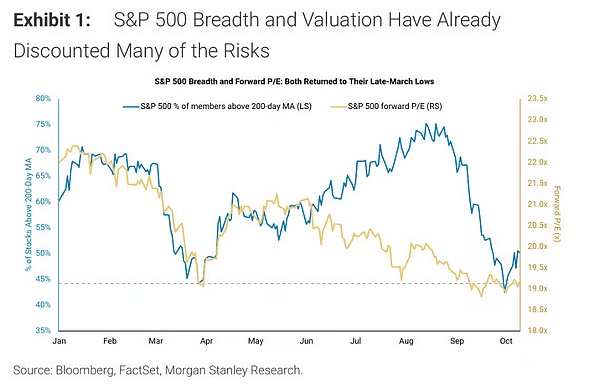
Wilson's breadth metric shows that the proportion of S&P 500 stocks trading above their 200-day moving average fell to 43% at the end of September, close to the low of 44% in late March. While it subsequently rebounded slightly to 50%, overall downward pressure remains. The S&P 500's forward price-to-earnings ratio also retested its March low of around 19. More importantly, the S&P 500 equity risk premium (forward earnings yield minus the 10-year yield) has fallen below zero, a level almost unseen since 2002.
The "stability" at the index level masks structural damage. Financial stocks are another warning sign—the sector has fallen 7.7% in 30 days, and its performance relative to the S&P 500 has fallen to its lowest level since 2019. Wilson considers the performance of financial stocks to be "one of the most important indicators of the near-term direction of the stock market," and whether the sector can stabilize before the start of the big bank earnings season will be a key window for judging the market's direction.
Is this a valuation issue or a growth issue?
Wilson believes that the current shock is still at the valuation level and has not yet evolved into a growth threat—but this judgment itself is controversial.
Data supporting his relatively optimistic stance includes: nominal GDP growth just recorded 8.5%; median earnings growth for S&P 500 companies is in the teens; the spread between the federal funds rate and core CPI is about 1.4%, "far below previous pre-recession peak levels"; and the spread between 10-year and 2-year Treasury yields maintains a positive slope of about +45 basis points, indicating that the market has not yet priced in a recession. Wilson concludes that, under these conditions, "a rare deterioration in growth within 12 to 18 months is historically likely."
However, he himself admitted that the equity risk premium falling to zero is also a historically rare occurrence. Goldman Sachs' Pasquariello, on the other hand, highlighted another risk: the wave of lock-up expirations in 2027 could push the net supply of US stocks to its highest level since the dot-com bubble of 2000, potentially putting pressure on the market's supply and demand dynamics.
Which of the two convergence paths is more likely to occur?
The divergence will eventually converge. The direction will be: will ordinary stocks catch up with the index, or will the index move downwards towards ordinary stocks?
Wilson provided two triggering conditions for observation: first, stabilization of financial stocks; and second, a decline in the MOVE index, which measures the volatility of US Treasuries. He pointed out that both have shown some signs of stabilization, but more follow-up is needed. According to Bloomberg, Goldman Sachs' Rich Privorotsky recently observed that implied volatility of long-term bonds has fallen by about 30% from its recent high, providing some breathing room for the market.
The coming weeks will be a crucial period of testing. September CPI data, Warsh's remarks at the IMF, and the FOMC meeting on October 28th will all be key events. Consensus expectations indicate that, influenced by a 9.6% month-on-month surge in gasoline prices, the September CPI may jump 0.6% month-on-month, rising to 3.6% year-on-year. Wilson believes that if the core CPI remains moderate and Warsh acknowledges that tighter financial conditions have partially substituted for interest rate hikes, the current pressure is likely to ease marginally.
However, Wilson's long position (corresponding to a target of 8300 points for the S&P 500) and Pasquariello's strategy of "shorting fixed income and going long on the Nasdaq 100" are essentially betting on two diametrically opposed outcomes. With equity risk premiums falling to zero, breadth indicators approaching dot-com bubble levels, and potential supply shocks looming, the market's preparation for the tail risk of "index downward convergence" may be far from adequate.
Source:Global Cybersecurity Alliance (GCSA)
Website:www.gcsa.org
소식을 이메일로 받기
개인정보를 존중합니다. 자세한 내용은 개인정보 처리방침